Improve productivity of your development teams and efficiently run your engineering org
See where your teams's time is going with issues chart which gives breakup of time spent on all the issues by their type.
Learn MoreSee if you need to imrpove product documentation or testing with help of triage charts
Learn MoreSee if your team is overloaded/underloaded using backlog charts
Learn MoreSee the ratio of prs getting repoened with overall prs merged to ascertain quality of code delivered
Learn MoreCheck if code is getting reviewed within acceptable limits with code to review metrics
Learn MoreSee how much time it is taking to merge the code after its reviewed with approval to merge charts
Learn MoreSee if bugs and features are getting closed within acceptable limits with the help of bugs/features charts
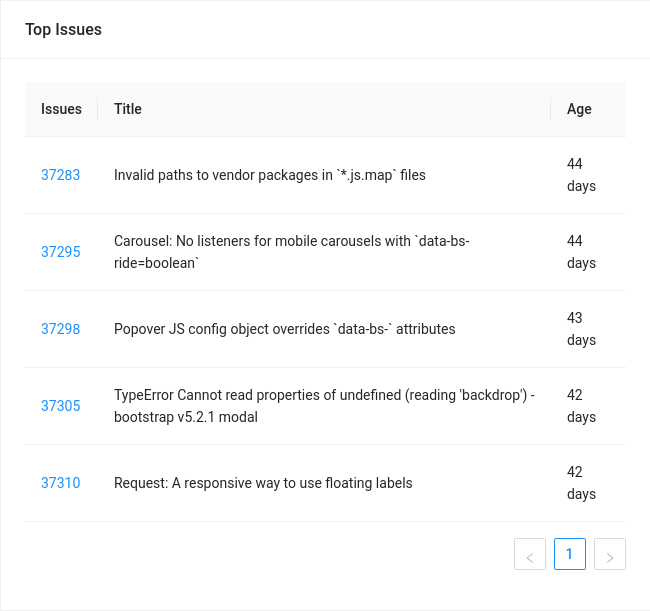
Learn MoreCheck top issues/reviews sorted by age to surface long running issues
Learn MoreGet single view of all the metrics for multiple repositories
Learn MoreRegister your organization
Set the github token with the appropriate permissions for the repositories you want to analyze
Enable the repositories that you want to be analyze in the app
Select team, repository and dates to analyze data
Simple pricing
5 users
5 repositories
5 month data retention
Scheduled reports on mail *
SignupFree 30 day trial
Additional users at $25/user/month
* Coming soon